
Name: Dhanush B M
Profile: Data Engineer/ Business Intelligence/ Data Analysis/ Data Management/ Business Operations
Email: dhanush.bijavara@gmail.com
Phone: +1 (940) 441-3238
Current Location: Dallas, Texas
Skills
SQL 90%About me
Education:
Master of Science in Information Systems & Technologies, University of North Texas. GPA 4.0/4.0
Post Graduation in Business Finance, Indian Institute of Finance- In Progress
Bachelor of Engineering, The National Institute of Engineering , Mysore, India. GPA 3.5/4.0
Work Experience:
North Texas Tollway Authority | Data Engineer, Texas
• Spearheading large-scale cloud modernization by migrating 400+ TB of enterprise data from SQL Server APS to Google Cloud, driving 2× faster performance and scalable data analytics across departments.
• Engineered intelligent automation with AI-powered data agents, ETL pipelines, and real-time monitoring dashboards in Looker and Power BI, enabling predictive insights and boosting operational efficiency by 70%.
University of North Texas | Data Analyst & Business Ambassador , Texas
• Leveraged data analytics to optimize inventory and sales strategies, reducing waste by 15% and improving demand forecasting accuracy during peak academic periods.
• Championed data-driven leadership initiatives and industry partnerships, increasing student engagement by 30% and connecting data professionals with emerging talent.
BZAAR | Analyst-Operation, California (Remote)
• Built analytics dashboards in Looker to visualize sales and inventory performance, enabling strategic decisions that improved delivery reliability by 25%.
• Applied data modeling to product development, increasing team productivity by 20% through actionable insights into sales and revenue patterns.
KultureHire | Business Analyst , India
• Collaborated with the founding team to design data-driven simulated work environments addressing employability gaps, shaping the platform’s early business intelligence strategy.
• Developed Power BI dashboards and performed content analytics on 500+ videos, uncovering engagement patterns that grew viewership by 15% and subscribers by 10%.
Certifications:
Certified Azure AI Engineer Associate
Certified Generative AI Fundamentals - Databricks
Certified Associate Google Cloud Engineer
Certified Tableau Desktop Specialist
AWS Certified Cloud Practitioner
Courses and Certifications
Do whatever you do intensely!


Projects
The only way of discovering the limits of the possible is to venture a little way past them into the impossible – Arthur C
Analytics
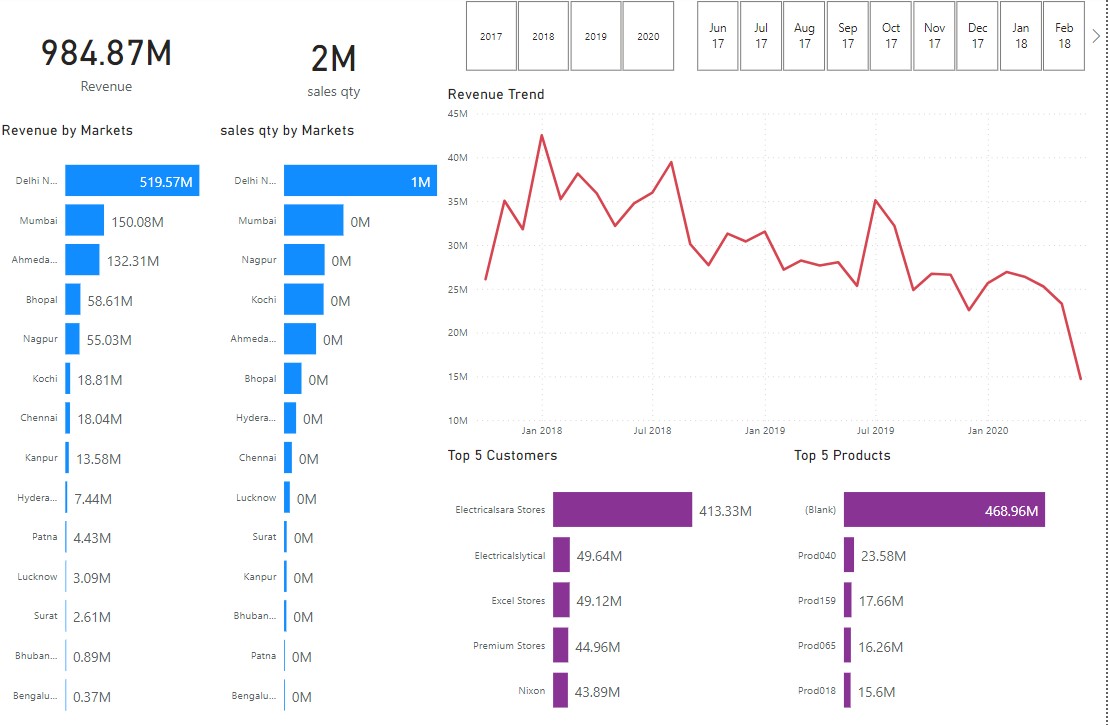
AtliQ hardware Sales insights
Analyzed sales data to identify trends and patterns, providing insights and recommendations to the management team
Web Development & Data Science
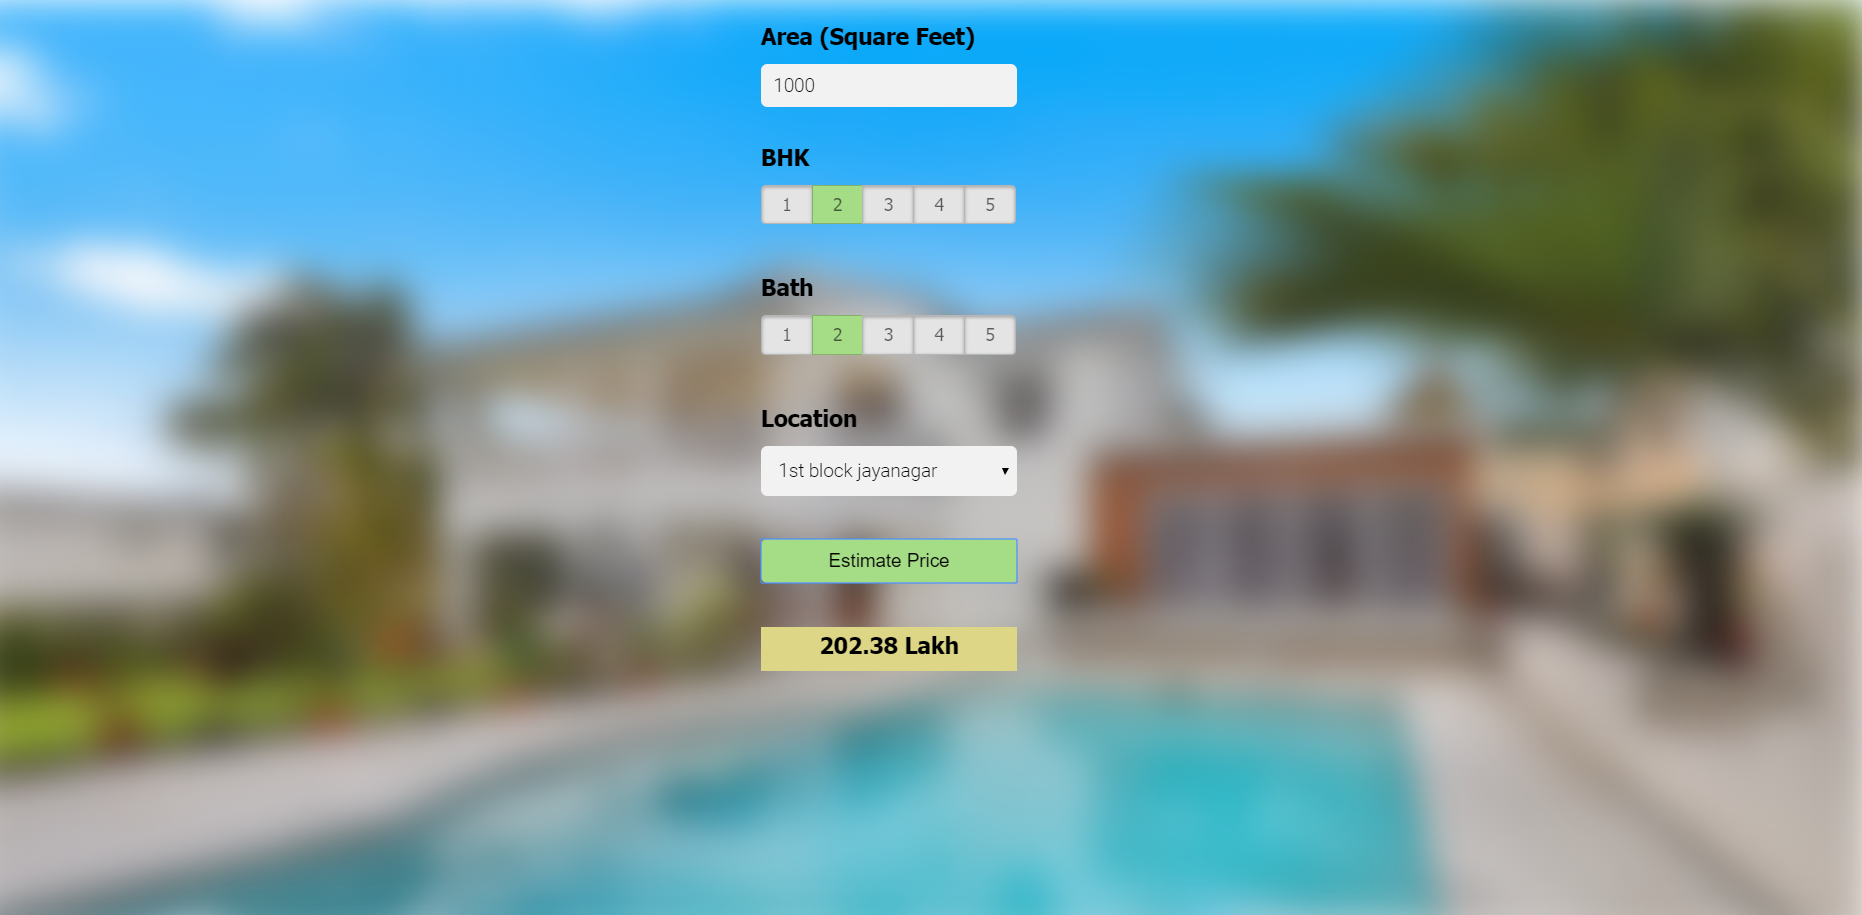
Build a real estate price prediction website
Built a web application using Flask, deployed on Amazon Web Services (AWS), and achieved 84% accuracy in predicting real estate prices in over 200+ locations in Bangalore city
Business Intelligence
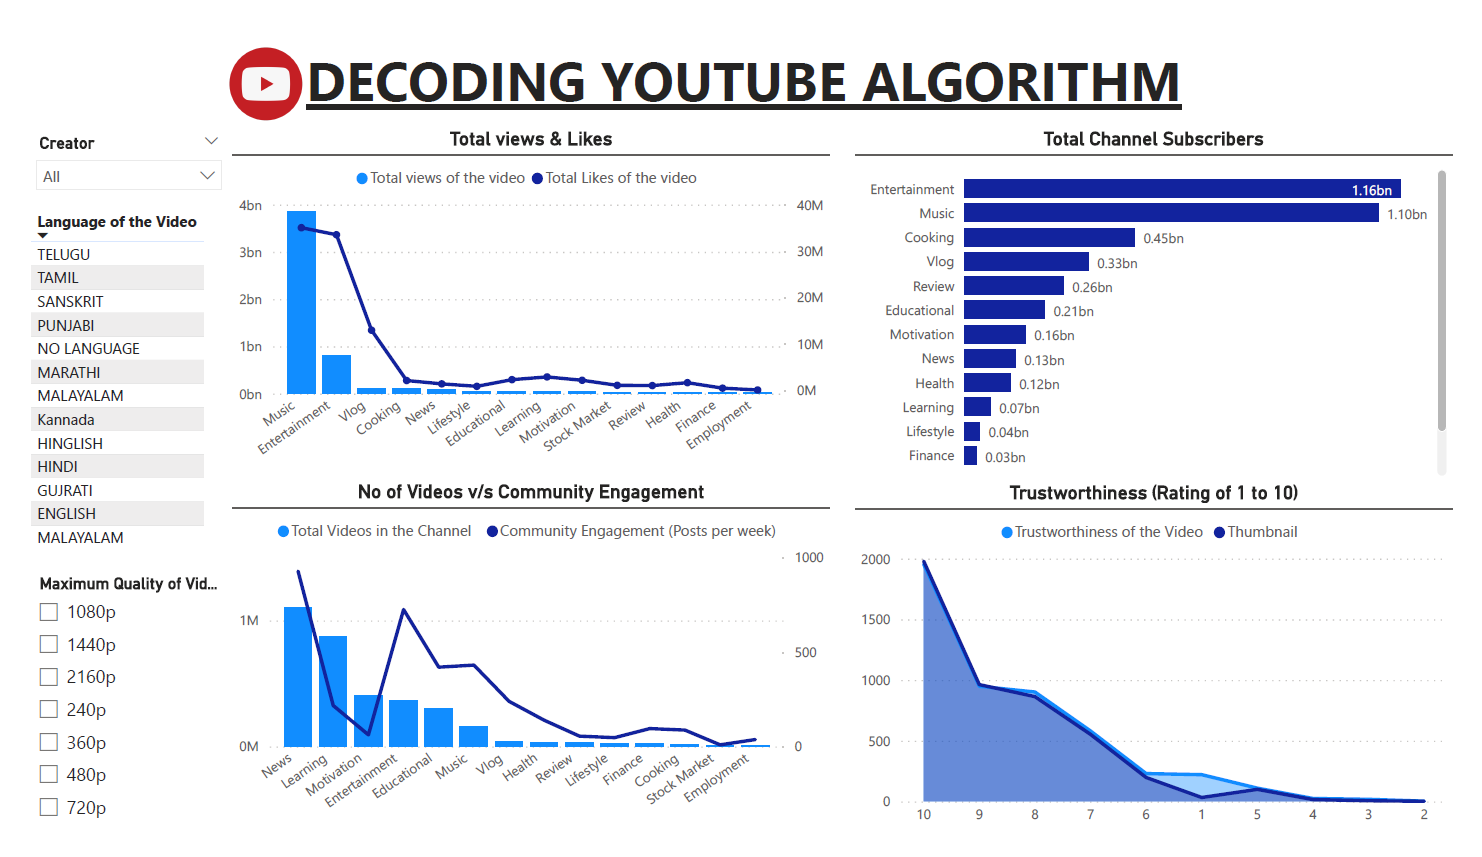
Decoding Youtube Algorithm
Conducted a comprehensive analysis of the YouTube algorithm, which helped to identify key factors that influence video popularity and resulted in actionable recommendations for optimizing video content

Development
Designing Bank Simulation Algorithm
Developed a Python program in Jupyter Notebook to simulate and analyze data for 20,000 customers, following PEP standards and using Markdown for documentation.
Cricket Analytics
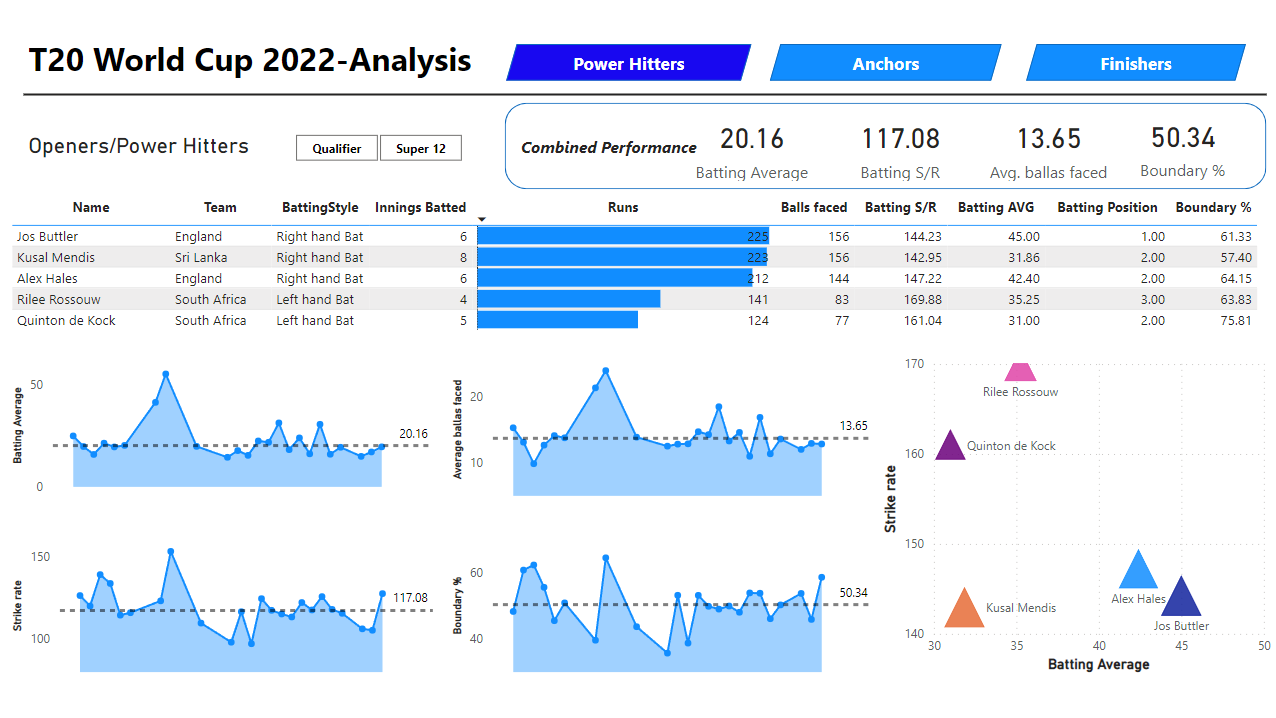
T20 Cricket WorldCup(2022)-Analysis
Conducted extensive data cleaning using Python and Pandas. Developed interactive Power BI dashboard to visualize and communicate performance insights of batters in T20 World Cup 2022.

Data Science
Cat vs Dog Image Classification Project
Developed a CNN-based image classification model to predict whether a given image is a cat or a dog
Analytics
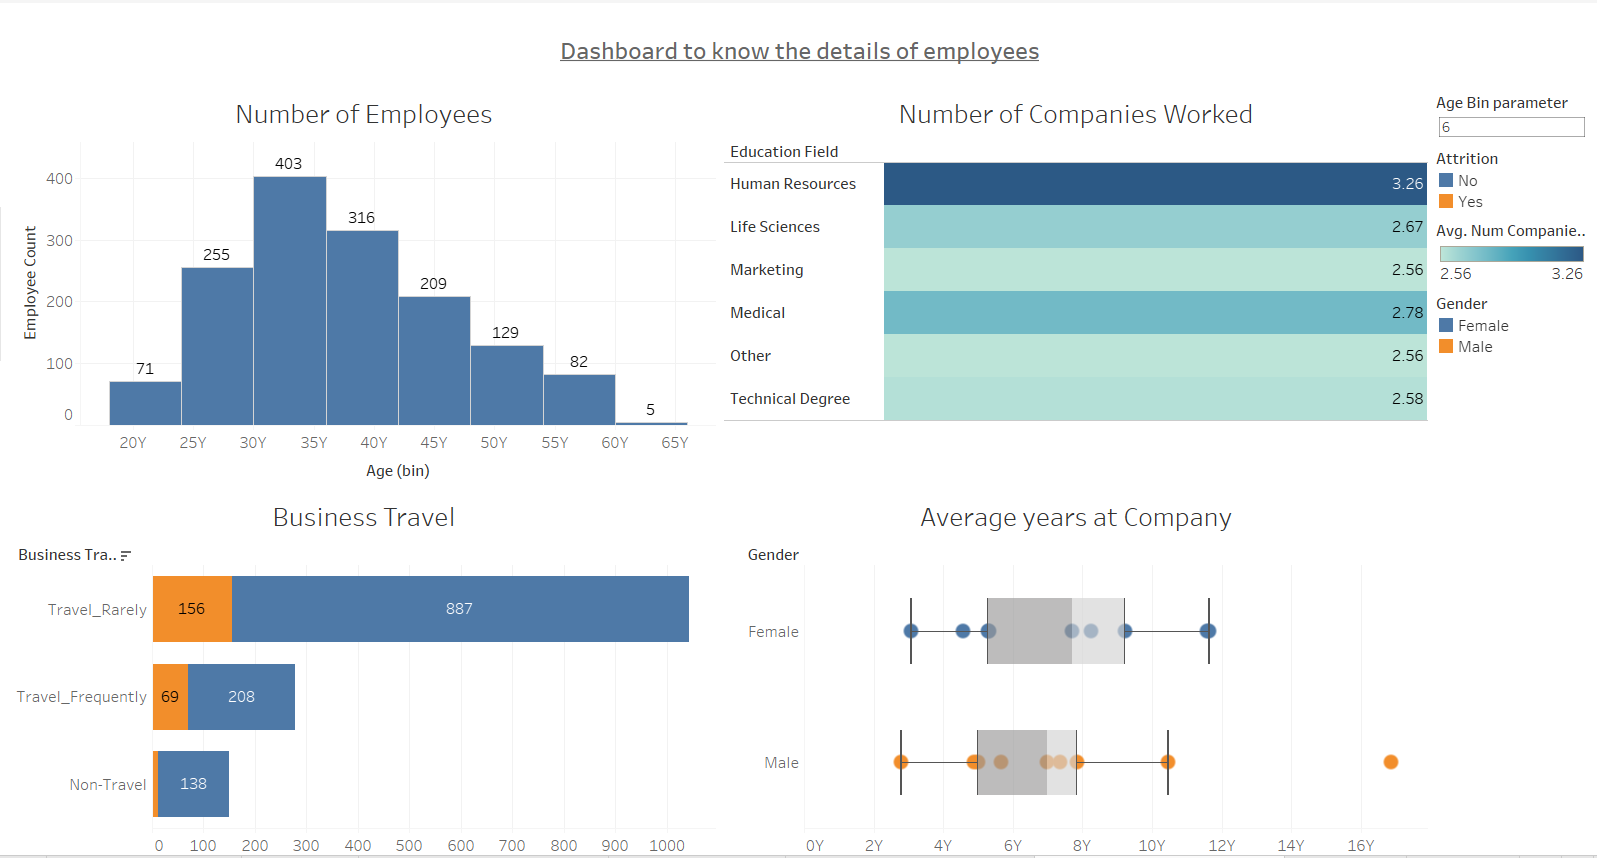
IBM HR Analytics Employee Attrition Performance
Led a data-driven analysis of employee attrition using IBM HR Data, uncovering actionable insights and providing strategic recommendations for enhanced retention and workforce planning.
Analytics
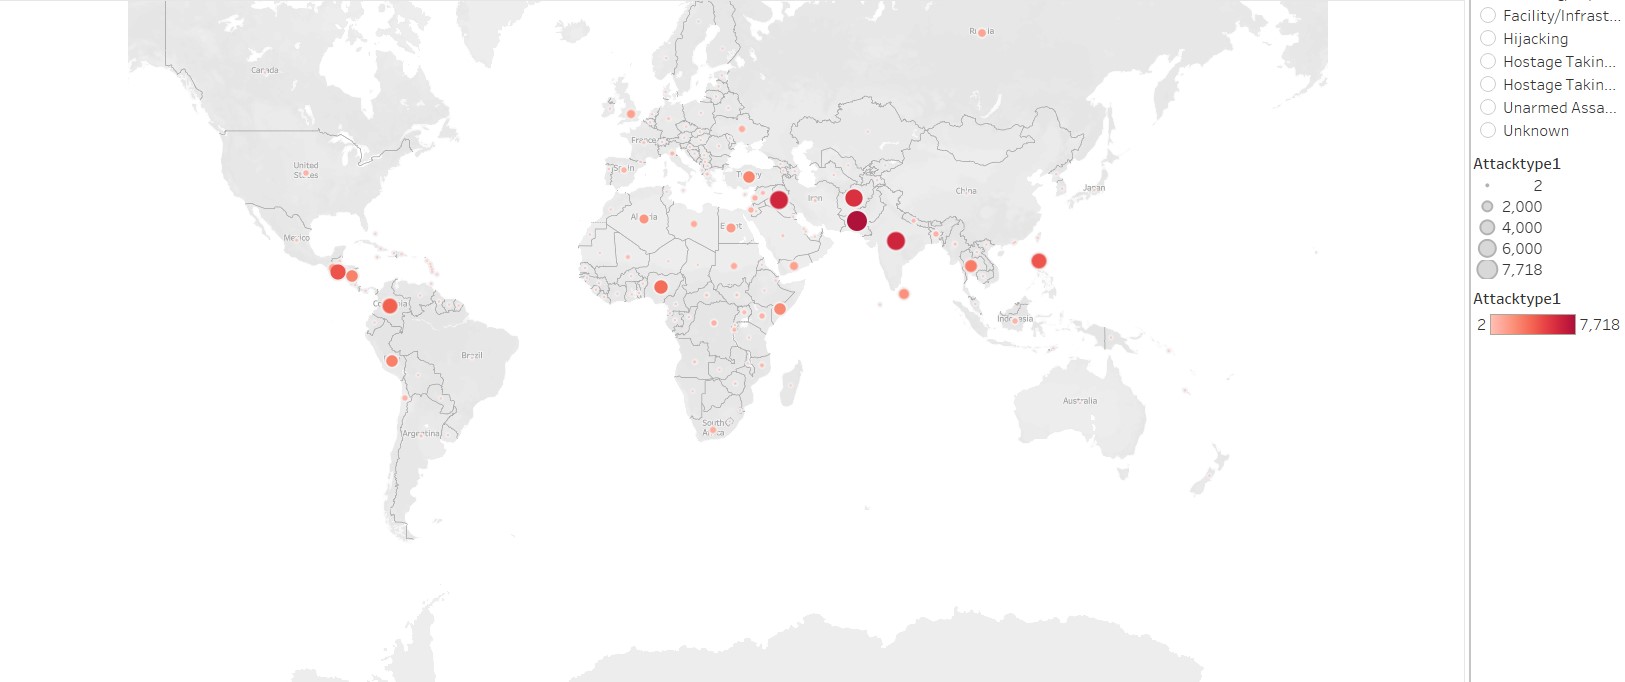
Exploratory Data Analysis- ‘Global Terrorism’
Exploratory data analysis on a dataset consisting of over 1,80,000 rows of data to identify hot zones of terrorism and address security issues
Data Visualization
Personal finance dashboard using Power BI
Successfully designed and implemented a finance dashboard to track personal expenses, income, and financial goals using Power BI
Analytics
‘Mental Health Survey’-Analysis
Conducted mental health survey analysis and created Excel dashboard to visualize mental health data by age, gender, and profession
Geographic Information system
Assessment of Soil Loss using GIS and Remote sensing
Worked on estimation of soil erosion in Western Ghats of Karnataka by integration of both technology and management using Geospatial tools
MY ARTICLES
Sharing is caring!